Tableau consulting & dashboard development | PeekGraph
Home / Tableau
Tableau consulting

Tableau consulting & dashboard development

See the shape of the number, not another workbook.

PeekGraph builds the Tableau data source, the LOD calculations, and the dashboards around them — so a filter click answers the question, and nobody is exporting to Excel to “check.”

Work covers Tableau Desktop, Tableau Cloud or Server, Prep, calculated fields, and published permissions. Existing .twb / .twbx files are starting points — not the finished view.

Workstreams

What a Tableau engagement includes

Tableau data sources, calculated fields, LOD, interactive dashboards, Cloud / Server publishing, and Prep. Scope is named on the call — nothing is billed from this page.

01 · Source

Data source & model

What it is

One extract or live source, with joins that match how the business thinks.

The pain

Five workbooks, five blends, five versions of “revenue.”

You get

A published source and a path that does not start with a new Excel dump.
02 · Calcs

Calculated fields & LOD

What it is

The metric lives in a calculation, not in a caption someone typed.

The pain

Table calc breaks when a filter moves.

You get

LOD and table calcs that survive the dashboard.

03 · Dashboards

Interactive dashboards

What it is

Actions, filters, and layout so a click answers the next question.

The pain

A wall of worksheets. Leadership asks “so what?”

You get

A tight dashboard and highlight/filter actions that hold up in a meeting.

04 · Publish

Cloud / Server & access

What it is

Who can view, who can edit, and where the workbook lives.

The pain

A .twbx on a laptop after the author leaves.

You get

Published workbooks, permissions, and a refresh that is not one person hitting F5.

05 · Prep

Tableau Prep

What it is

Dirty files cleaned once, then run again next week.

The pain

Unioning 14 CSVs by hand before Monday’s dashboard can open.

You get

A Prep flow and a workbook that starts from clean grain.

06 · Viz

Advanced viz

What it is

Maps, dual axis, parameters, and set actions when a bar chart is not the question.

The pain

A default chart that hides the outlier the meeting is about.

You get

The mark that fits the decision — not a gallery of every chart Tableau can draw.

Fit

Who this is for

Operators

Already in Tableau, tired of workbooks only the author can change.

Finance & FP&A

A filter that does not silently change the total.

Leadership

One published view, not a pack of .twbx files in email.

Sample

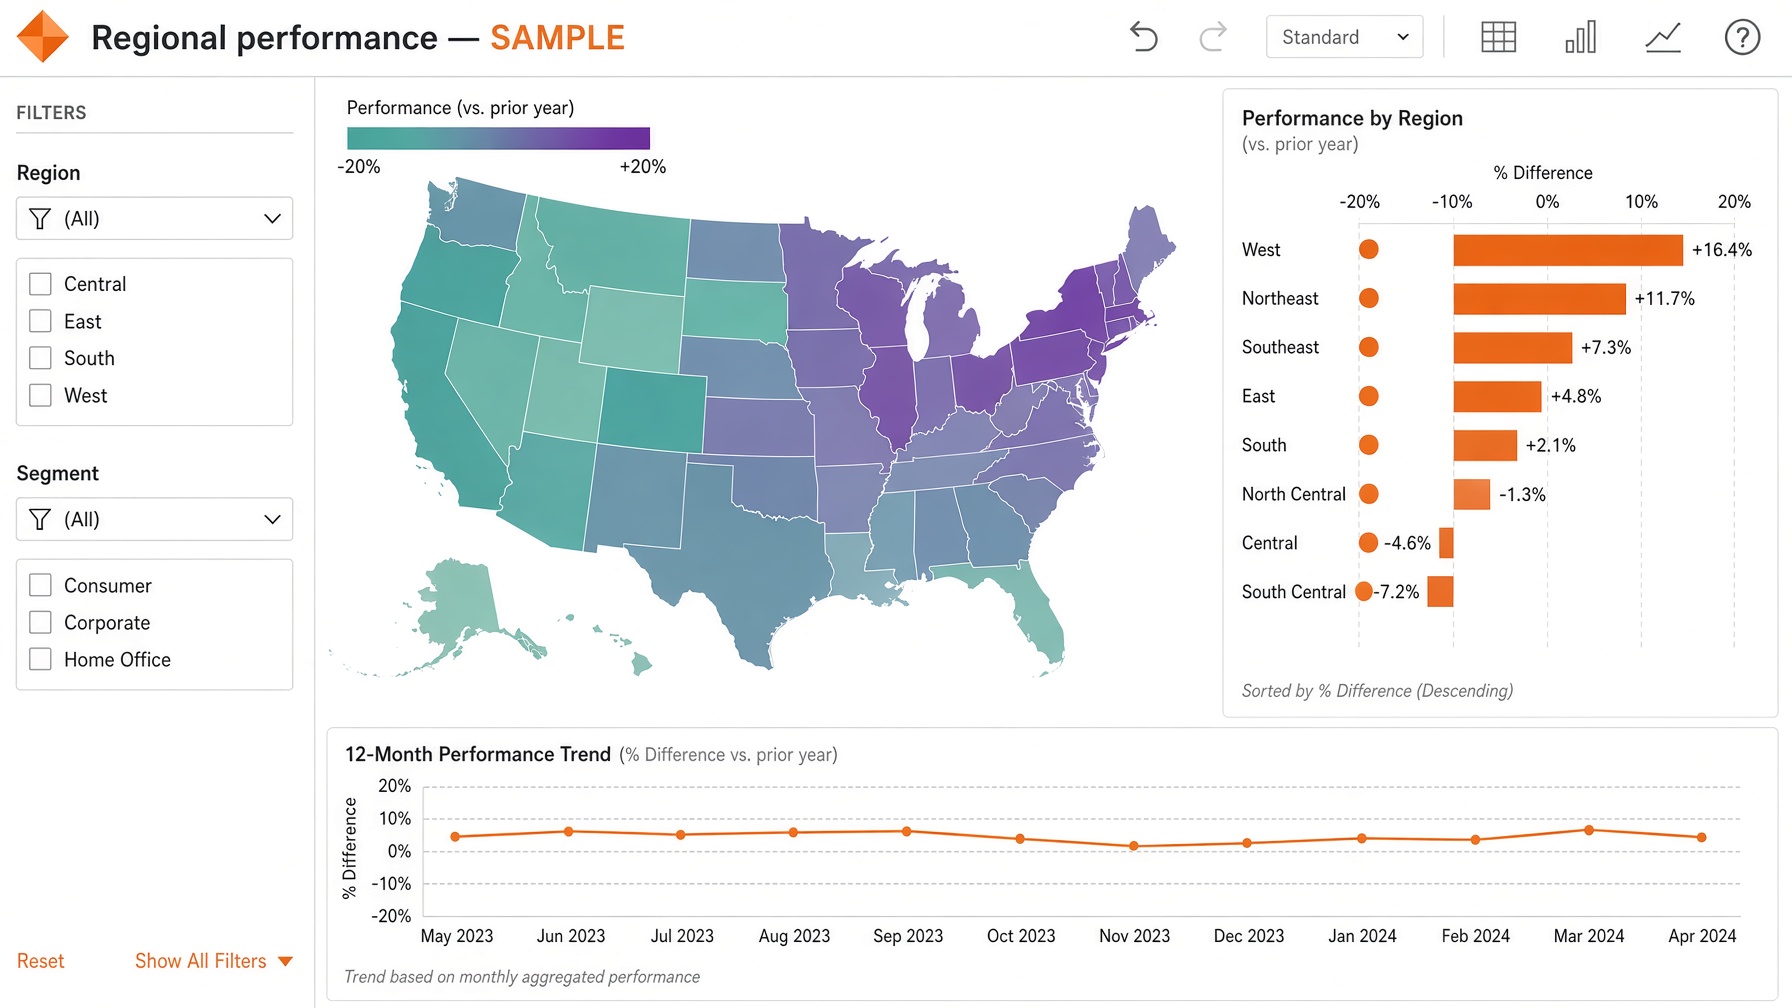
A Tableau view, not a template

View sample dashboard
Sample Tableau regional performance dashboard
Sample · Tableau

Regional performance

A forty-page pack nobody can filter → one regional view leadership can click. Demonstration data, not a client file.

FAQ

Tableau questions before a call

Can PeekGraph start from an existing .twbx?

Yes. Most Tableau work starts with the workbook already in the meeting.

Tableau Cloud or Server?

Either. The call is where the license you already pay for is named.

Can Tableau connect to Excel, SQL, or Salesforce?

Yes. Live or extract. Prep is in scope when the files are still dirty.

How much does a Tableau project cost?

A written range comes after the call. Nothing is billed from this page.

Is confidential company data used as a case study?

No. The sample on this page is a demonstration.

Does Tableau work run remotely with a US team?

Yes. The files stay with you at handoff.