Semantic model
What it is
One structured model so every report reads the same tables and relationships.
The pain
Two dashboards, two numbers for the same KPI.
You get
A star schema, clean relationships, and a short dictionary of tables.
One model. One number. A view leadership trusts.
PeekGraph builds the Power BI semantic model, the DAX measures, and the executive dashboards around them — so Monday’s report matches Friday’s, and nobody is defending a spreadsheet.
Work covers Power BI Desktop, Power BI Service, Power Query, row-level security, and paginated reports. Excel, SQL, and existing .pbix files are starting points — not the finished view.
Power BI data modeling, DAX, dashboards, paginated reports, workspace access, and refresh. Scope is named on the call — nothing is billed from this page.
One structured model so every report reads the same tables and relationships.
Two dashboards, two numbers for the same KPI.
A star schema, clean relationships, and a short dictionary of tables.
Measures live in one place. Visuals consume them.
Five people calculate “margin” five ways.
A measure table and DAX that still works when the grain changes.
A Monday view leadership can open without a walkthrough.
Forty pages and a meeting only to explain the report.
One to three pages and drill-through where it matters.
Pixel-true printable output for finance and ops.
Dashboard export that clips totals.
Parameterized layouts and repeating headers.
Who can publish, who can view, which rows each person sees.
A regional manager saw another region’s numbers.
Workspace roles and row-level security rules.
Dirty inputs cleaned once, then refreshed on a schedule.
Someone pastes a CSV every Friday.
Stable queries and a failure you hear about before the meeting.
A weekly ops meeting that still starts with three Excel files.
Numbers that survive an audit question, not a dashboard only the builder understands.
Power BI is already paid for. One view is missing.
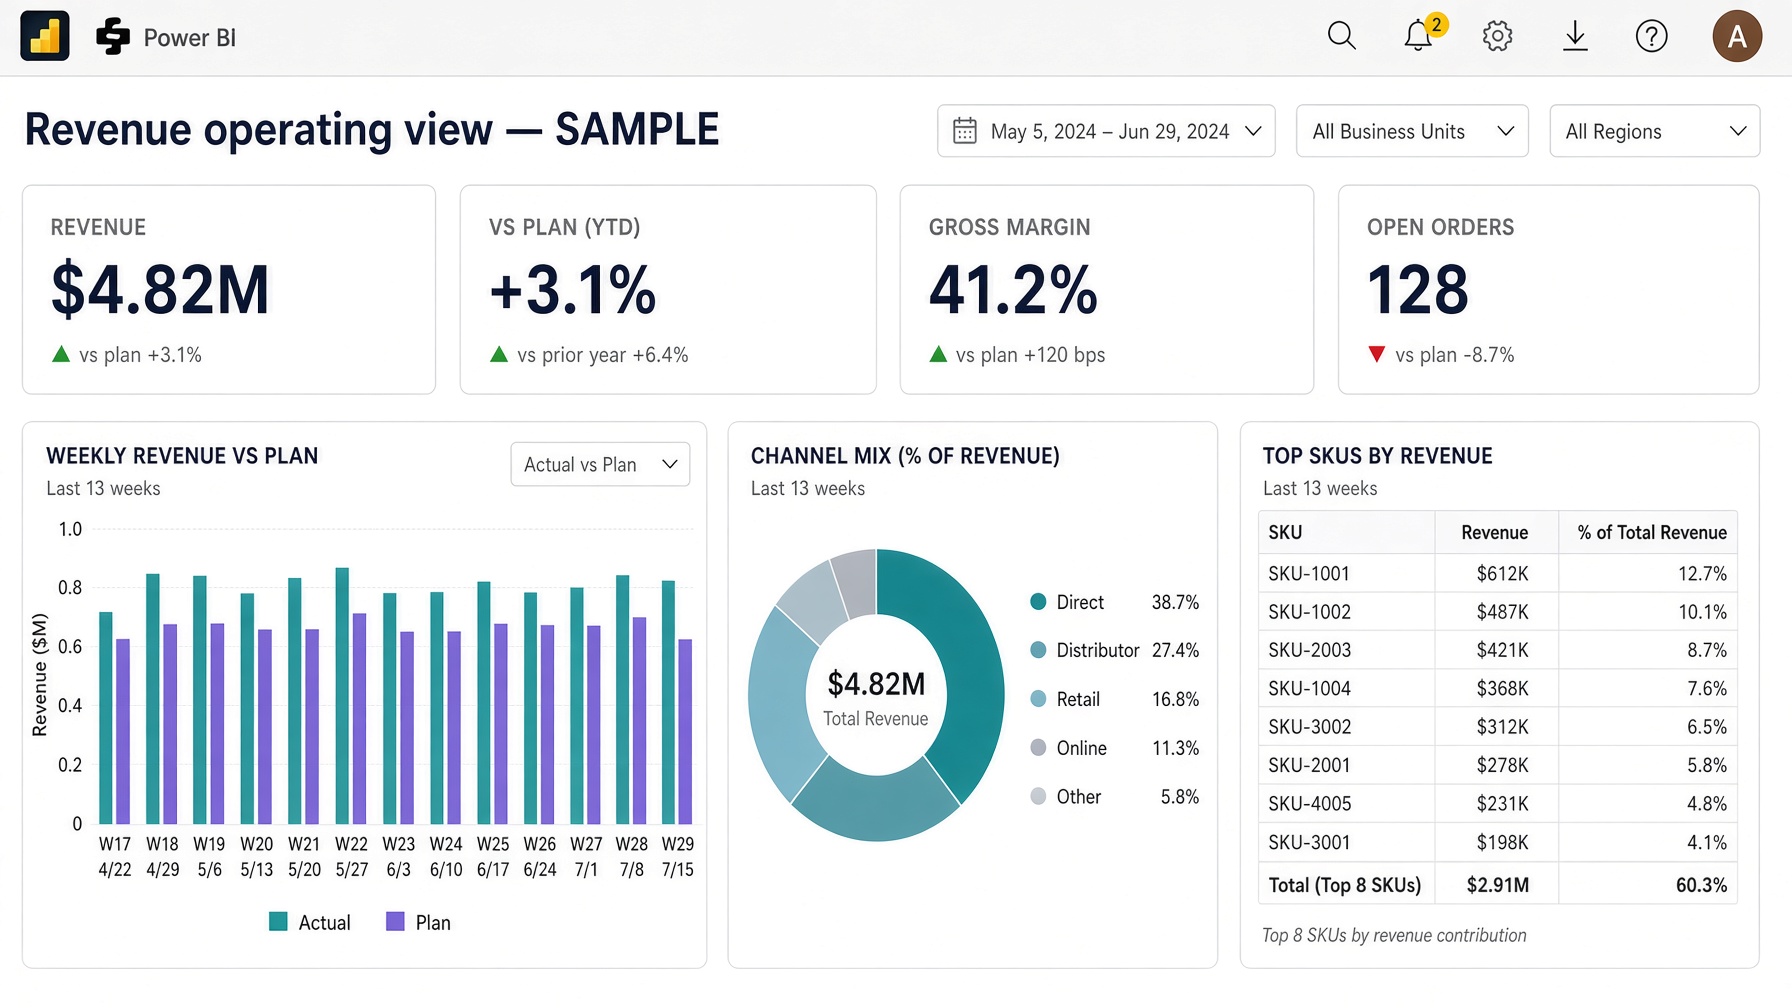
Three Excel files for the same KPI → one semantic model, one revenue number. Demonstration data, not a client file.
Yes. Most Power BI work starts with the file already in the meeting.
Yes. Power Query can land Excel, SQL, and common SaaS exports into one model.
A written range comes after the call. Nothing is billed from this page.
A focused executive view is usually weeks, not months — after the metrics are locked.
No. The sample on this page is a demonstration.
Yes. The files stay with you at handoff.